K-priemery

This notebook follows the content of the lesson on clustering, which demonstrates the k-means algorithm.
import numpy as np
from matplotlib import pyplot as plt

from sklearn.datasets import make_blobs
np.random.seed(7)
Vykonajte nasledujúcu bunku kódu na načítanie knižníc potrebných pre prácu.
Ďalšia bunka obsahuje kód, ktorý vytvára množinu údajov. Skladá sa zo 100 inštancií s dvoma číselnými atribútmi. Vykonajte ho na vytvorenie množiny údajov.
def create_data():
  X, _ = make_blobs(n_samples=100, n_features=2, centers=4, cluster_std=1.5, random_state=6)
  return X

X = create_data()
Vytvorenú množinu údajov môžete graficky zobraziť spustením ďalšej bunky. Prvý atribút je zobrazený pozdĺž osi x a druhý atribút pozdĺž osi y.
plt.xlabel('Attribute 1')
plt.ylabel('Attribute 2')

plt.scatter(X[:, 0], X[:, 1])
plt.show()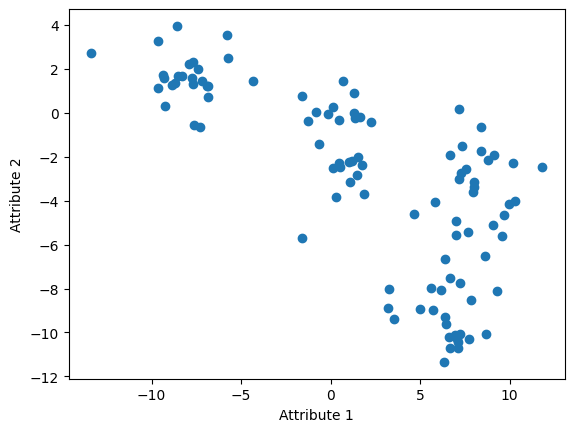
Ďalšia bunka obsahuje nastavenia, ktoré sa budú odteraz používať: počet zhlukov "k" a ich farby.
k = 4
cluster_colors = ['orange', 'yellow', 'purple', 'green']
Funkcia "calculate_distance" vypočíta euklidovskú vzdialenosť medzi dvoma bodmi v rovine. Neskôr sa použije na výpočet vzdialenosti medzi ťažiskami a inštanciami.
def calculate_distance(x1, x2):
  return np.sqrt((x1[0]-x2[0])**2 + (x1[1]-x2[1])**2)
Funkcia "generate_centroids" generuje náhodné inštancie "k" potrebné na inicializáciu algoritmu k-priemerov.
def generate_centroids(X, k):
    N = X.shape[0]
    indices = np.random.randint(low=0, high=N, size=k)
    return X[indices]
centroids = generate_centroids(X, 4)
Funkcia "show_centroids" nám umožňuje vidieť, kde sa nachádzajú ťažiská vo vzťahu k zhlukom.
def show_centroids(X, centroids, cluster_colors=cluster_colors):
  plt.xlabel('Attribute 1')
  plt.ylabel('Attribute 2')

  plt.scatter(X[:, 0], X[:, 1])

  for i, centroid in enumerate(centroids):
    plt.scatter(centroid[0], centroid[1], color=cluster_colors[i], marker='*')

  plt.show()
show_centroids(X, centroids)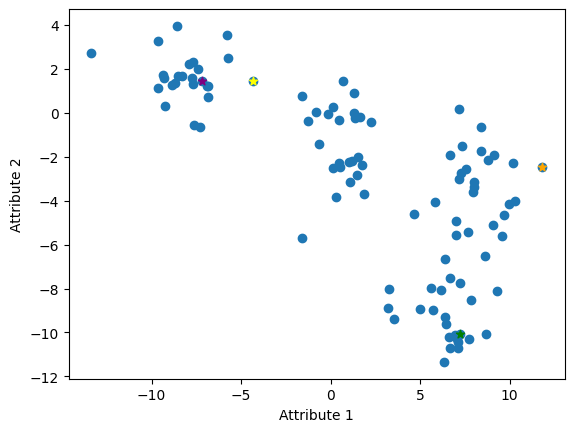
Funkcia "divide_data" rozdeľuje inštancie do klastrov. Pre každý prípad najprv vypočíta vzdialenosti k ťažiskám. Potom identifikuje ťažisko najbližšie k inštancii (vzdialenosť k tomuto ťažisku je najmenšia) a priradí inštanciu k klastri určenému týmto ťažiskom. Na rozlíšenie zhlukov použijeme čísla 0, 1, 2, ..., k-1.
def divide_data(X, centroids, k):

  # initialize the list of cluster labels
  cluster_labels = []

  # iterate through the dataset instance by instance
  for x in X:

    # initialize the list of distances to centroids
    distances_to_centroids = []

    # then for each centroid ...
    for centroid in centroids:
      # ... calculate the distance between the instance and the centroid
      d = calculate_distance(x, centroid)

      # ... and add it to the list of distances
      distances_to_centroids.append(d)

    # when we have visited all centroids,
    # choose the centroid closest to the instance x
    label = np.argmin(distances_to_centroids)

    # conclude that the instance belongs to the cluster
    # determined by that centroid
    cluster_labels.append(label)

  # the result of the function is an array of cluster labels
  return np.array(cluster_labels)
cluster_labels = divide_data(X, centroids, k)Ďalšia bunka obsahuje funkciu, ktorá vypočíta počet inštancií na klaster. Môžete ho spustiť a zobraziť číselné rozdelenie zhlukov.
def show_number_of_instances_per_cluster(k, cluster_labels, cluster_colors=cluster_colors):
  plt.bar(np.arange(0, k), np.bincount(cluster_labels), color=cluster_colors)
  plt.xticks(np.arange(0, k), np.arange(0, k))
  plt.show()
show_number_of_instances_per_cluster(k, cluster_labels)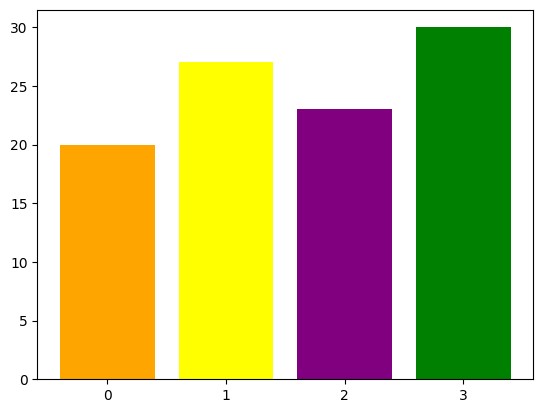
Funkcia "show_clusters" zobrazuje rozdelenie údajov podľa klastra. Ťažiská hviezdokopy sú znázornené ako čierne hviezdy kvôli viditeľnosti.
def show_clusters(X, centroids, cluster_labels, cluster_colors=cluster_colors):
  plt.xlabel('Attribute 1')
  plt.ylabel('Attribute 2')

  for i, x in enumerate(X):
    instance_color = cluster_colors[cluster_labels[i]]
    plt.scatter(x[0], x[1], color=instance_color)

  for centroid in centroids:
    plt.scatter(centroid[0], centroid[1], color='black', marker='*')

  plt.show()
show_clusters(X, centroids, cluster_labels)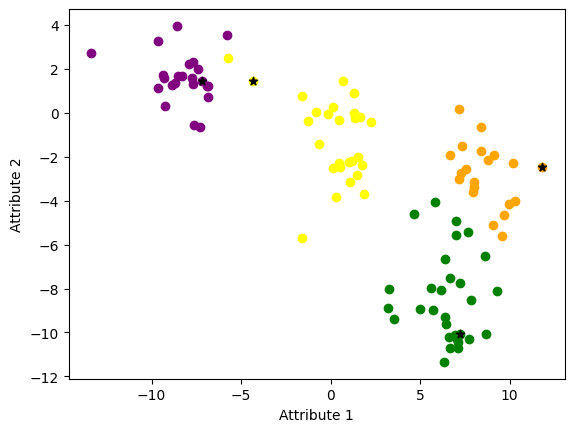
Funkcia "calculate_new_centroids" aktualizuje ťažiská klastra. Robí to tak, že spriemeruje hodnoty všetkých inštancií, ktoré patria do klastra, a výslednú hodnotu deklaruje ako nové ťažisko.
def calculate_new_centroids(X, cluster_labels, k):

  # initialize the list of new centroids
  new_centroids = []

  # for each cluster
  for i in range(0, k):

    # ... extract the instances that belong to it
    instance_indices = cluster_labels == i
    instances_in_cluster = X[instance_indices]

    # then calculate the new centroid value
    # by averaging all instances in the cluster
    new_centroid = np.average(instances_in_cluster, axis=0)

    # add the calculated new centroid to the list of all centroids
    new_centroids.append(new_centroid)

  # the result of the function is an array of new centroids
  return np.array(new_centroids)
new_centroids = calculate_new_centroids(X, np.array(cluster_labels), k)Aby sme overili, kde sa nachádzajú nové ťažiská, zavoláme funkciu "show_centroids".
show_centroids(X, new_centroids)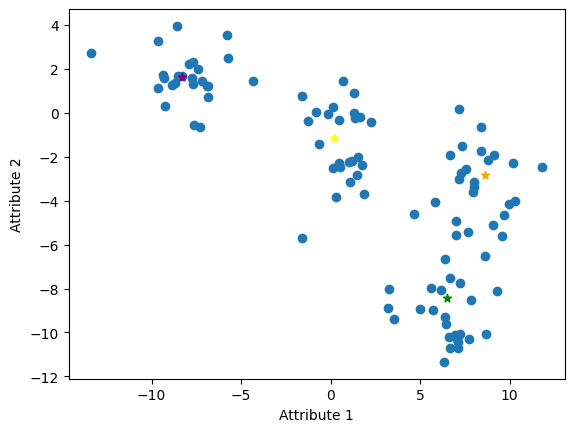
Funkcia "execute_clustering" kombinuje všetky kroky, ktorými sme prešli jednotlivo:
- generuje počiatočné ťažidlá
- v iteráciách, rozdeľuje inštancie do zhlukov a potom vypočítava nové ťažidlá.
def execute_clustering(X, k, epsilon=1e-4, max_iterations=300):

  # step of initializing centroids
  centroids = generate_centroids(X, k)

  # in each iteration of the loop
  for i in range(0, max_iterations):

    # step 1: dividing instances into clusters
    cluster_labels = divide_data(X, centroids, k)

    # step 2: calculating new centroids
    new_centroids = calculate_new_centroids(X, cluster_labels, k)

    # checking stopping criteria
    # if they are met, we stop the algorithm
    if np.linalg.norm(new_centroids - centroids) < epsilon:
      break
    # otherwise, we move to the next iteration
    centroids = new_centroids.copy()

  # the result of the function is the final cluster labels and centroid values
  return cluster_labels, new_centroids
final_cluster_labels, final_centroids = execute_clustering(X, k)Najprv môžeme skontrolovať číselné rozdelenie inštancií vo finálnych zhlukoch.
show_number_of_instances_per_cluster(k, final_cluster_labels)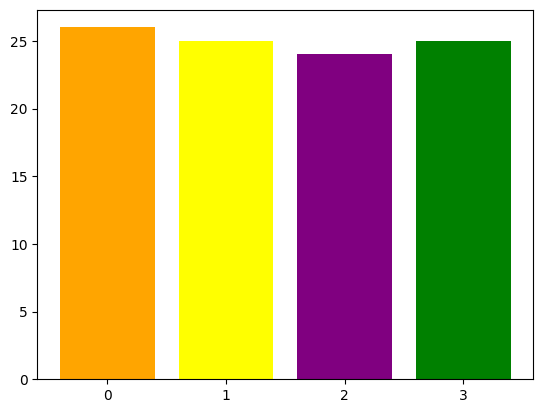
Teraz si ukážme posledné zhluky.
show_clusters(X, final_centroids, final_cluster_labels)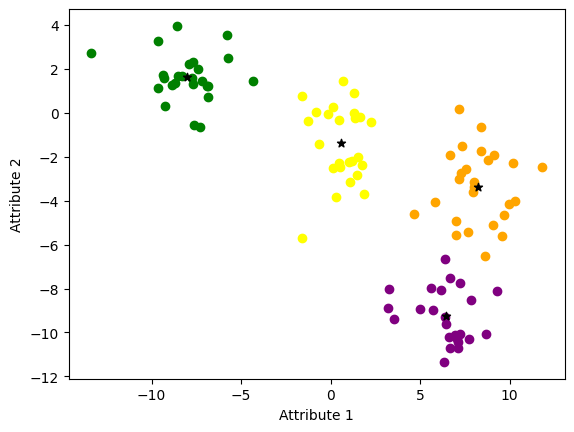
Nasledujúci blok kódu sa používa na zobrazenie animácie všetkých krokov rozdelenia množiny údajov do klastrov.
from IPython.display import display, clear_output
def show_animation(X, k):
  fig = plt.figure()
  ax = fig.add_subplot(1, 1, 1)

  # initialization
  num_iterations = 300
  epsilon = 1e-4

  # initial centroid values
  centroids = generate_centroids(X, k)

  # individual iterations
  for iteration in range(0, num_iterations):
    cluster_labels = divide_data(X, centroids, k)

    # display clusters
    ax.cla()
    ax.set_title('Iteration number: ' + str(iteration))

    for i, x in enumerate(X):
      instance_color = cluster_colors[cluster_labels[i]]
      ax.scatter(x[0], x[1], color=instance_color)

    for centroid in centroids:
      ax.scatter(centroid[0], centroid[1], color='black', marker='*')

    display(fig)
    clear_output(wait=True)
    # plt.pause(0.5)

    # calculate centroids for the next iteration
    new_centroids = calculate_new_centroids(X, cluster_labels, k)
    if np.linalg.norm(new_centroids - centroids) < epsilon:
      break

    centroids = new_centroids.copy()
show_animation(X, k)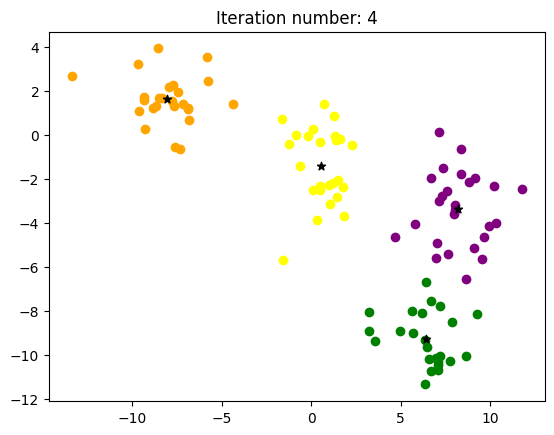
Completion requirements:
- Make a submission