Algoritam K-sredina (K-Means)

Ova sveska prati sadržaj lekcije o klasterovanju u kojoj se prikazuje algoritam k-sredina.
Izvrši sledeću ćeliju sa kodom kako bi učitao biblioteke koje su neophodne za rad.
import numpy as np
from matplotlib import pyplot as plt

from sklearn.datasets import make_blobs
np.random.seed(7)
Sledeća ćelija sadrži kod kojim se kreira skup podataka. On se sastoji od 100 instanci sa po dva numerička atributa. Izvrši je i kreiraj skup podataka.
def create_data():
  X, _ = make_blobs(n_samples=100, n_features=2, centers=4, cluster_std=1.5, random_state=6)
  return X

X = create_data()
Ovako kreirani skup možeš grafički da prikažeš ako izvršiš narednu ćeliju. Duž x-ose je prikazan prvi atribut, a duž y-ose drugi atribut.
plt.xlabel('Attribute 1')
plt.ylabel('Attribute 2')

plt.scatter(X[:, 0], X[:, 1])
plt.show()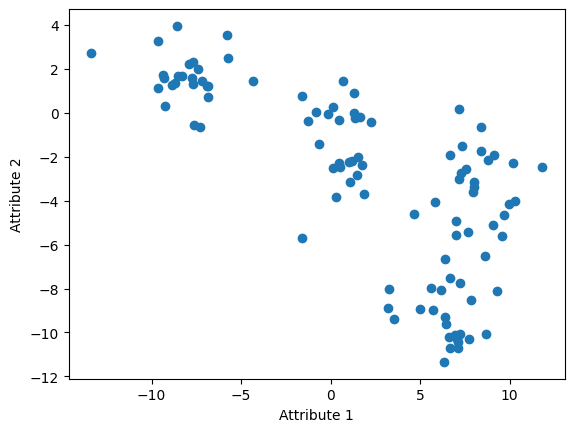
Sledeća ćelija sadrži podešavanja koja će se nadalje koristiti: broj klastera k i njihove boje.
k = 4
cluster_colors = ['orange', 'yellow', 'purple', 'green']
Funkcija `calculate_distance` računa euklidsko rastojanje između dve tačke u ravni. U daljem kodu će se koristiti kod računanja rastojanja između centroida i instanci.
def calculate_distance(x1, x2):
  return np.sqrt((x1[0]-x2[0])**2 + (x1[1]-x2[1])**2)
Funkcija `generate_centroids` generiše ` k ` nasumičnih instanci koje su neophodne za inicijalizaciju algoritma k-sredina.
def generate_centroids(X, k):
    N = X.shape[0]
    indices = np.random.randint(low=0, high=N, size=k)
    return X[indices]
centroids = generate_centroids(X, 4)
Funkcija `show_centroids` nam omogućava da vidimo gde se u odnosu na klastere nalaze.
def show_centroids(X, centroids, cluster_colors=cluster_colors):
  plt.xlabel('Attribute 1')
  plt.ylabel('Attribute 2')

  plt.scatter(X[:, 0], X[:, 1])

  for i, centroid in enumerate(centroids):
    plt.scatter(centroid[0], centroid[1], color=cluster_colors[i], marker='*')

  plt.show()
show_centroids(X, centroids)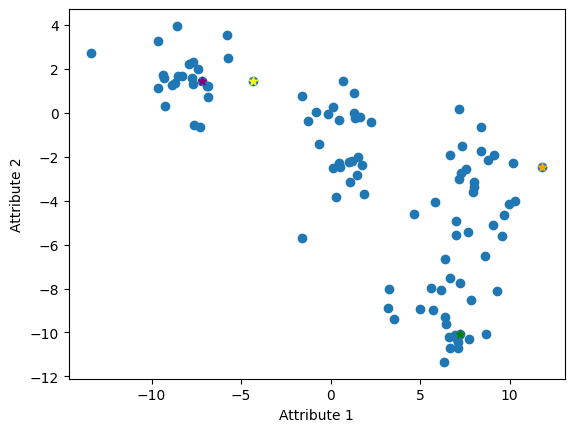
Funkcija `divide_data` vrši podelu instanci po klasterima. Ona za svaku instancu prvo izračuna rastojanja do centroida. Zatim , izdvoji centroid kojem je instanca najbliža (rastojanje do te centroide je najmanje) a potom i pridruži instancu klasteru koji on određuje. Za razlikovanje klastera koristićemo brojeve 0, 1, 2,..., k-1.
def divide_data(X, centroids, k):

  # initialize the list of cluster labels
  cluster_labels = []

  # iterate through the dataset instance by instance
  for x in X:

    # initialize the list of distances to centroids
    distances_to_centroids = []

    # then for each centroid ...
    for centroid in centroids:
      # ... calculate the distance between the instance and the centroid
      d = calculate_distance(x, centroid)

      # ... and add it to the list of distances
      distances_to_centroids.append(d)

    # when we have visited all centroids,
    # choose the centroid closest to the instance x
    label = np.argmin(distances_to_centroids)

    # conclude that the instance belongs to the cluster
    # determined by that centroid
    cluster_labels.append(label)

  # the result of the function is an array of cluster labels
  return np.array(cluster_labels)
cluster_labels = divide_data(X, centroids, k)Sledeća ćelija sadrži funkciju koja izračunava broj instanci po klasterima. Možeš da je izvršiš i vidiš kakav je brojni odnos klastera.
def show_number_of_instances_per_cluster(k, cluster_labels, cluster_colors=cluster_colors):
  plt.bar(np.arange(0, k), np.bincount(cluster_labels), color=cluster_colors)
  plt.xticks(np.arange(0, k), np.arange(0, k))
  plt.show()
show_number_of_instances_per_cluster(k, cluster_labels)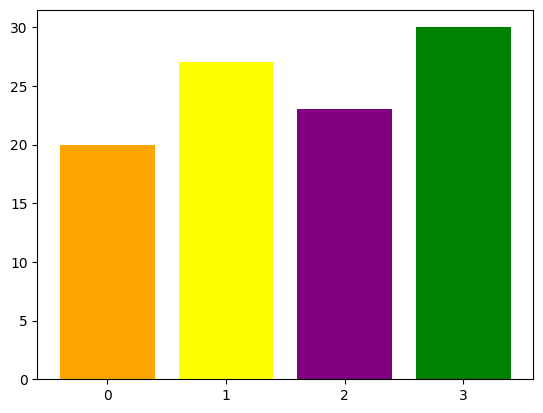
Funkcija `show_clusters` prikazuje podelu podataka po klasterima. Centroide klastera su zbog vidljivosti prikazane kao crne zvezdice.
def show_clusters(X, centroids, cluster_labels, cluster_colors=cluster_colors):
  plt.xlabel('Attribute 1')
  plt.ylabel('Attribute 2')

  for i, x in enumerate(X):
    instance_color = cluster_colors[cluster_labels[i]]
    plt.scatter(x[0], x[1], color=instance_color)

  for centroid in centroids:
    plt.scatter(centroid[0], centroid[1], color='black', marker='*')

  plt.show()
show_clusters(X, centroids, cluster_labels)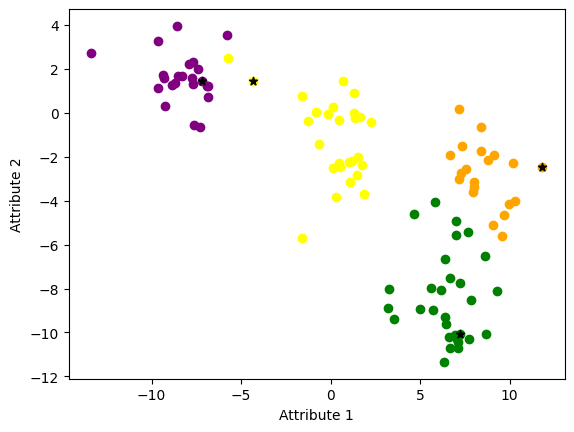
Funkcija `calculate_new_centroids` vrši ažuriranje centroida klastera. To radi tako što uproseči vrednost svih instanci koje pripadaju jednom klasteru i tako dobijenu vrednost proglasi novom centroidom.
def calculate_new_centroids(X, cluster_labels, k):

  # initialize the list of new centroids
  new_centroids = []

  # for each cluster
  for i in range(0, k):

    # ... extract the instances that belong to it
    instance_indices = cluster_labels == i
    instances_in_cluster = X[instance_indices]

    # then calculate the new centroid value
    # by averaging all instances in the cluster
    new_centroid = np.average(instances_in_cluster, axis=0)

    # add the calculated new centroid to the list of all centroids
    new_centroids.append(new_centroid)

  # the result of the function is an array of new centroids
  return np.array(new_centroids)
new_centroids = calculate_new_centroids(X, np.array(cluster_labels), k)Da bi se uverili gde se nalaze nove centroide, pozvaćemo funkciju `show_centroids`.
show_centroids(X, new_centroids)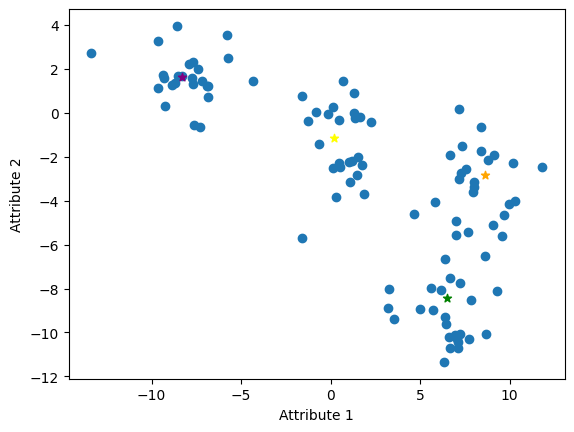
Funkcija `execute_clustering` spaja sve korake koje smo prošli pojedinačno:
* generiše početne centroide
* u iteracijama vrši podele instanci po klasterima, a zatim i izračunava nove centroide.
def execute_clustering(X, k, epsilon=1e-4, max_iterations=300):

  # step of initializing centroids
  centroids = generate_centroids(X, k)

  # in each iteration of the loop
  for i in range(0, max_iterations):

    # step 1: dividing instances into clusters
    cluster_labels = divide_data(X, centroids, k)

    # step 2: calculating new centroids
    new_centroids = calculate_new_centroids(X, cluster_labels, k)

    # checking stopping criteria
    # if they are met, we stop the algorithm
    if np.linalg.norm(new_centroids - centroids) < epsilon:
      break
    # otherwise, we move to the next iteration
    centroids = new_centroids.copy()

  # the result of the function is the final cluster labels and centroid values
  return cluster_labels, new_centroids
final_cluster_labels, final_centroids = execute_clustering(X, k)Možemo prvo da proverimo brojčani odnos instanci u finalnim klasterima.
show_number_of_instances_per_cluster(k, final_cluster_labels)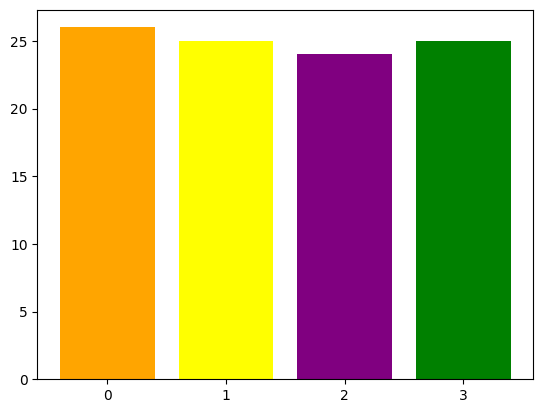
Now let's show the final clusters.
show_clusters(X, final_centroids, final_cluster_labels)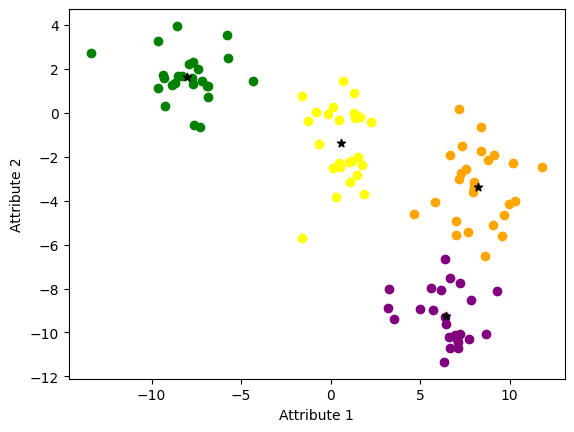
Sledeći blok koda služi za prikaz animacije svih koraka podele skupa podataka na klastere.
from IPython.display import display, clear_output
def show_animation(X, k):
  fig = plt.figure()
  ax = fig.add_subplot(1, 1, 1)

  # initialization
  num_iterations = 300
  epsilon = 1e-4

  # initial centroid values
  centroids = generate_centroids(X, k)

  # individual iterations
  for iteration in range(0, num_iterations):
    cluster_labels = divide_data(X, centroids, k)

    # display clusters
    ax.cla()
    ax.set_title('Iteration number: ' + str(iteration))

    for i, x in enumerate(X):
      instance_color = cluster_colors[cluster_labels[i]]
      ax.scatter(x[0], x[1], color=instance_color)

    for centroid in centroids:
      ax.scatter(centroid[0], centroid[1], color='black', marker='*')

    display(fig)
    clear_output(wait=True)
    # plt.pause(0.5)

    # calculate centroids for the next iteration
    new_centroids = calculate_new_centroids(X, cluster_labels, k)
    if np.linalg.norm(new_centroids - centroids) < epsilon:
      break

    centroids = new_centroids.copy()
show_animation(X, k)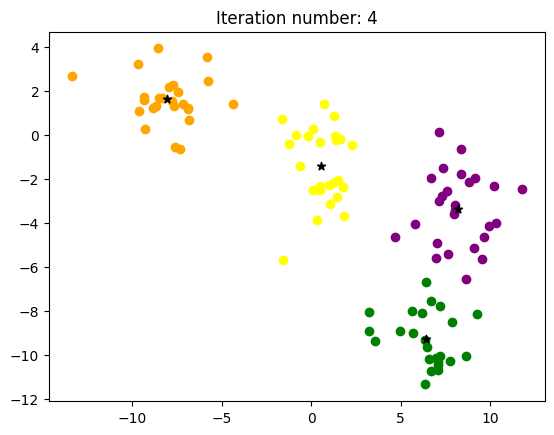
Completion requirements:
- Make a submission