
Logistička regresija
Evo jednostavne vežbe Jupiter Notebook za studente da nauče o klasifikaciji koristeći logističku regresiju. Ova vežba će ih voditi kroz učitavanje skupa podataka, obuku logističkog regresijskog modela i procenu njegovog učinka.
Vežba: Klasifikacija pomoću logističke regresije
Cilj: Učitajte skup podataka. Obučite model logističke regresije. Procenite performanse modela.
Preduslovi:Instalirajte biblioteku scikit-learn. Koristite jednostavan skup podataka kao što je Iris skup podataka.
Korak 1: Instalirajte potrebne biblioteke:
%pip install scikit-learnKorak 2: Učitajte skup podataka:
import numpy as np
import matplotlib.pyplot as plt
from sklearn import datasets
from sklearn.model_selection import train_test_split
from sklearn.linear_model import LogisticRegression
from sklearn.metrics import accuracy_score, confusion_matrix, classification_report
Korak 3: Učitajte skup podataka:
# Load the Iris dataset
iris = datasets.load_iris()
X = iris.data
y = iris.target

# Use only two classes for binary classification
X = X[y != 2]
y = y[y != 2]
Korak 4: Podelite skup podataka:
# Split the dataset into training and testing sets
X_train, X_test, y_train, y_test = train_test_split(X, y, test_size=0.3, random_state=42)
Korak 5: Obučite model logističke regresije:
# Initialize and train the logistic regression model
model = LogisticRegression()
model.fit(X_train, y_train)
Korak 6: Napravite predviđanja:
# Make predictions on the test set
y_pred = model.predict(X_test)
Korak 7: Napravite predviđanja:
# Evaluate the model's performance
accuracy = accuracy_score(y_test, y_pred)
cm = confusion_matrix(y_test, y_pred)
cr = classification_report(y_test, y_pred)
print(f'Accuracy: {accuracy}')
print('Confusion Matrix:')
print(cm)
print('Classification Report:')
print(cr)
Step 8: Visualize the Results:
# Visualize the confusion matrix
plt.figure(figsize=(8, 6))
plt.imshow(cm, interpolation='nearest', cmap=plt.cm.Blues)
plt.title('Confusion Matrix')
plt.colorbar()
tick_marks = np.arange(len(iris.target_names[:2]))
plt.xticks(tick_marks, iris.target_names[:2], rotation=45)
plt.yticks(tick_marks, iris.target_names[:2])

fmt = 'd'
thresh = cm.max() / 2.
for i, j in np.ndindex(cm.shape):
    plt.text(j, i, format(cm[i, j], fmt),
             ha="center", va="center",
             color="white" if cm[i, j] > thresh else "black")

plt.ylabel('True label')
plt.xlabel('Predicted label')
plt.tight_layout()
plt.show()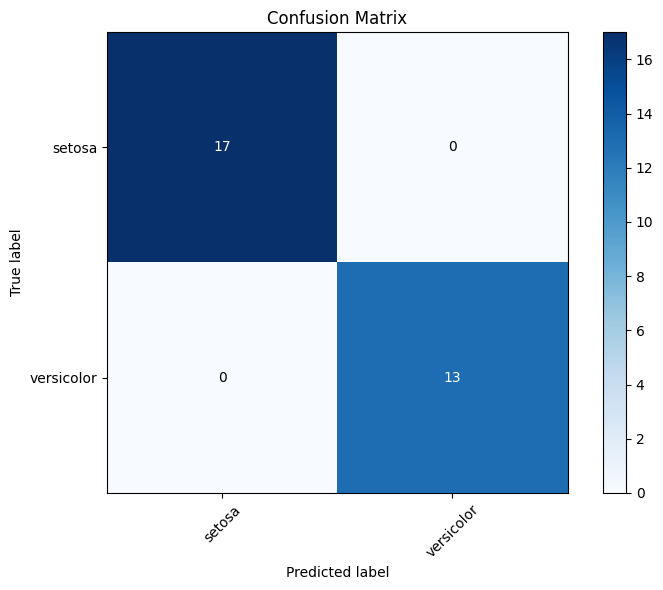
Uputstvo za studente:
Pratite korake da biste instalirali potrebne biblioteke i učitali skup podataka. Obučite model logističke regresije i procenite njegove performanse. Izmenite kod da biste koristili različite skupove podataka ili dodali više funkcija modelu. Istražite uticaj različitih hiperparametara na performanse modela.
Completion requirements:
- Make a submission