Completion requirements:
- View
The k-mean algorithm
The K-mean is an unusual name for an algorithm. Read on to find out what's behind this choice.
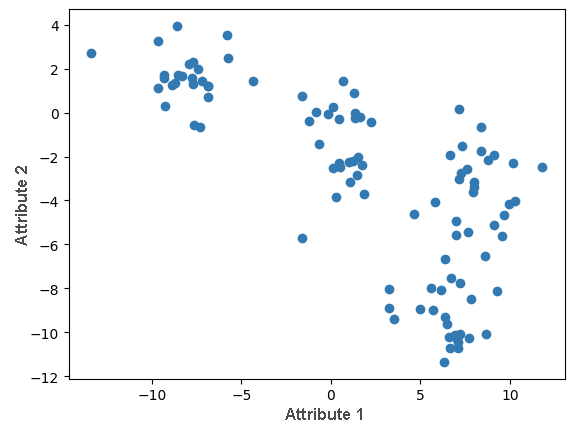
To make it easier to follow the story of the x-mean algorithm, we will use the dataset shown in the figure below. It consists of 100 pairs of points, imagine that these are the values of some two numerical attributes.
This section is paired with the Jupyter Notebook 12-k-means.ipynb. To follow the content further, click on the link and then click  on the button to open the content in the Google Colab environment. If you are viewing the notebooks on your local machine, find the notebook with the same name among the contents and run it. For more detailed instructions, see the Hands-on Zone section and the Jupyter Exercise Notebook lesson.
In the accompanying material, you can generate all the images and animations yourself.
The k-mean algorithm should find k clusters in the dataset. The clusters that this algorithm looks for are determined by the centroid , an instance that represents the center of the cluster.
The initial step of the algorithm is the initialization step. In it, we need to select randomly x centroids. Then we need to repeat the following steps:
For each instance, we need to calculate the Euclidean distance to each of the x centroids, and then associate the instance with the cluster whose centroid it is closest to. Once we have arranged all the instances, we move on to the next step.
For each of the x clusters, we need to select new centroids. We do this by calculating the average of the instances that are in each of the clusters and declaring this value as the new centroid. After that, we go back to step 1 again.
The clustering algorithm ends when the values of the cluster centroids stabilize. This would mean that in two successive iterations we get centroids that differ very little, less than some predetermined accuracy.
The k-mean algorithm itself is not unpleasant to program, so we will do it together. Before that, let's consider some technical details:
One instance of a data set is a pair of numbers, say (2, -3). This means that the centroid will also have a pair of numbers and will have two cooridnates;
If (10, 2) and (4, -4) are two instances of a data set, we will calculate the instance representing their average as (10 + 42, 2 − 42) = (7, -1);
If (0, 0) and (3, 4) are two instances of a data set, we will calculate the Euclidean distance between them as (3 − 0)2 + (4 − 0)2.
In the dataset, we will look for four clusters. We will consider why we chose this issue a little later. Now let's get ready to program the algorithm.
The variable k denotes the number of clusters. K = 4.
We will denote the centroids of the cluster with the centroid variable. Since we have k of the cluster, this will be an array of length k . One centroid is, as we said, one pair of numbers, so the elements of this array will be pairs of numbers.
In the process of clustering, we need to keep track of which cluster we associate with which instance. That's why we'll use labels to tag clusters, similar to the classification tasks. These can be values 0, 1, 2 and 3. In general, some values 0, 1, 2, ..., k-1. We're going to keep all the labels in a series of labele_klastera.
Now let's introduce the function generisi_centroide(X, k) that generates the initial centroids. Its arguments are the set of instances X and the number of clusters k, and the function itself randomly selects k numbers from the interval from 0 to 100 and returns the instances that are in those positions.
def generate_centroids(X, k):
    N = X.shape[0]
    indices = np.random.randint(low=0, high=N, size=k)
    return X[indices]
In the figure below, the generated centroids are shown. Each of them is in the color of the cluster it represents.
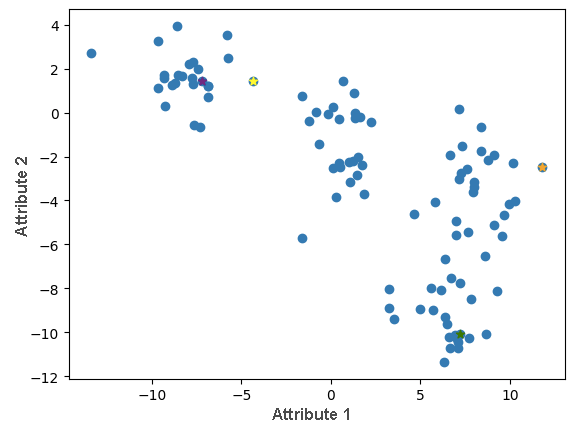
Initial values of centroids
Now let's write a function podeli_podatke(X, centroids, k) to divide a set of instances into clusters. This function has as arguments the set of instances X, the current centroid centroids, and the number of clusters k. For each instance, we calculate the value of the distance to each centroid, then select the centroid that is closest and conclude that the instance belongs to the cluster it specifies.
def divide_data(X, centroids, k):

  # initialize the list of cluster labels
  cluster_labels = []

  # iterate through the dataset instance by instance
  for x in X:

    # initialize the list of distances to centroids
    distances_to_centroids = []

    # then for each centroid ...
    for centroid in centroids:
      # ... calculate the distance between the instance and the centroid
      d = calculate_distance(x, centroid)

      # ... and add it to the list of distances
      distances_to_centroids.append(d)

    # when we have visited all centroids,
    # choose the centroid closest to the instance x
    label = np.argmin(distances_to_centroids)

    # conclude that the instance belongs to the cluster
    # determined by that centroid
    cluster_labels.append(label)

  # the result of the function is an array of cluster labels
  return np.array(cluster_labels)
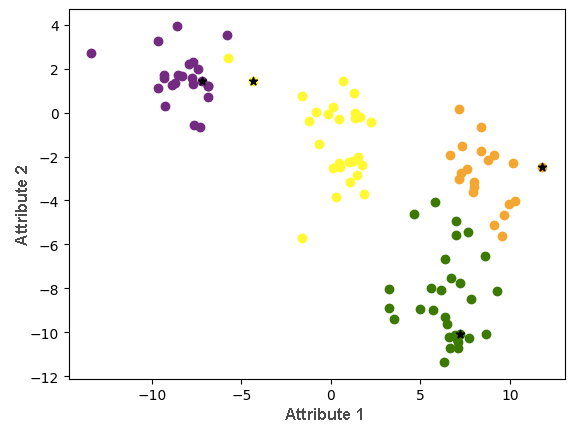
In the image below, you can see the first iteration of the division of instances into clusters.
Now let's write a function izracunaj_nove_centroide(X, labele_klastera, k) that can calculate the values of new centroids based on the current division of instances into clusters. Its arguments are the set of instances X, the current instances of labele_klastera, and the number of clusters k. For each of the clusters, this function should extract the instances that belong to it and then calculate their average.
def calculate_new_centroids(X, cluster_labels, k):

  # initialize the list of new centroids
  new_centroids = []

  # for each cluster
  for i in range(0, k):

    # ... extract the instances that belong to it
    instance_indices = cluster_labels == i
    instances_in_cluster = X[instance_indices]

    # then calculate the new centroid value
    # by averaging all instances in the cluster
    new_centroid = np.average(instances_in_cluster, axis=0)

    # add the calculated new centroid to the list of all centroids
    new_centroids.append(new_centroid)

  # the result of the function is an array of new centroids
  return np.array(new_centroids)
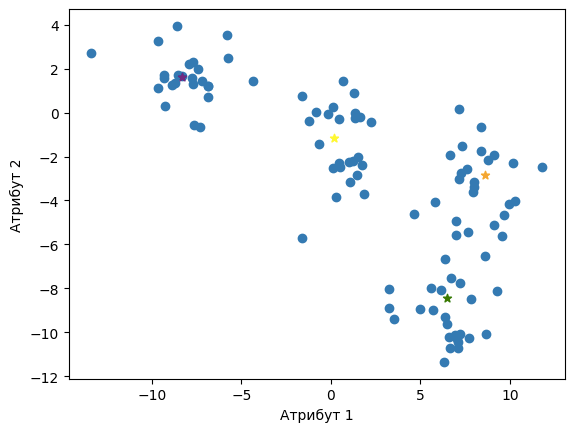
The new centroids are now shown in the image below. You will notice that the centroids of the yellow and purple clusters have "separated".
It remains to consolidate the tasks of individual steps into a function that will repeat them a sufficient number of times. It will be a function izvrsi_klasterovanje(X, k, epsilon = 1e-4, broj_iteracija = 300) in which X represents the set of instances, k the number of clusters, the epsilon closeness that needs to be satisfied by the centroids of the cluster in order for the algorithm to stop. There is also a maximum number of iterations max_broj_iteracija which we additionally provide a stop criterion.
def execute_clustering(X, k, epsilon=1e-4, max_iterations=300):

  # step of initializing centroids
  centroids = generate_centroids(X, k)

  # in each iteration of the loop
  for i in range(0, max_iterations):

    # step 1: dividing instances into clusters
    cluster_labels = divide_data(X, centroids, k)

    # step 2: calculating new centroids
    new_centroids = calculate_new_centroids(X, cluster_labels, k)

    # checking stopping criteria
    # if they are met, we stop the algorithm
    if np.linalg.norm(new_centroids - centroids) < epsilon:
      break
    # otherwise, we move to the next iteration
    centroids = new_centroids.copy()

  # the result of the function is the final cluster labels and centroid values
  return cluster_labels, new_centroids
Executing this function also brings us to the final division of the set of instances into clusters, which is shown in the figure below.
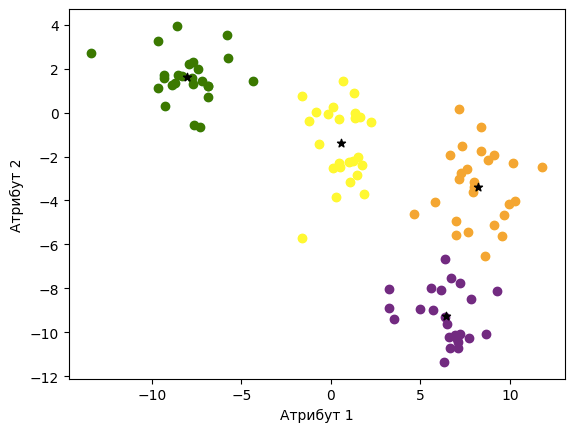
In the accompanying code book, you can also see an animation that follows this division. Some steps rely on random decisions (for example, if an instance is equally close to multiple centroids), so don't be confused if some values differ slightly.
Last modified: Sunday, 22 June 2025, 5:15 AM