k-Nearest Neighbors Algorithm

Este caderno segue a lição sobre o algoritmo k-Nearest Neighbors.
Execute a célula abaixo e carregue as bibliotecas de que precisaremos para trabalhos futuros.
import numpy as np
from matplotlib import pyplot as plt
Primeiro, processaremos os dados. A instance da variável representa todas as instâncias no conjunto de dados. A primeira linha lista as ocorrências azuis e a segunda linha lista as vermelhas. A instância verde que precisa ser classificada também é especificada separadamente.
 instances = [
        (-0.25, 0, 1), (-2.5, 2, 1), (-1.5, 1.5, 1), (-2.5, 0.5, 1), (-2.5, 2, 1), (-2.5, 4, 1), (0.5, 3, 1), # plave
        (-1.5, 3.5, 0), (1, 3.5, 0), (3, 3, 0), (0.5, 0.25, 0), (0.75, -0.5, 0) #crvene
  ]

green_instance = (0, 0)
A função a seguir nos ajudará a exibir a vizinhança da instância verde determinada pela escolha do número k.
def show_neighborhood(k, instances=instances, green_instance=green_instance):

  # set up the plot panel
  fig, ax = plt.subplots()
  ax.set_aspect(1)
  ax.set_axis_off()
  fig.set_size_inches(5, 5)

  # display instances
  for instance in instances:
    # determine color and shape for each instance
    color = 'red' if instance[2] == 0 else 'blue'
    shape = '^' if instance[2] == 0 else 's'
    ax.scatter(instance[0], instance[1], color=color, marker=shape)

  # display the green instance
  ax.scatter(green_instance[0], green_instance[1], color='green')

  # calculate the distance from the green instance to all instances in the set
  distances = np.array([np.sqrt(instance[0]**2 + instance[1]**2) for instance in instances])

  # determine the k-th distance
  k_distance = np.sort(distances)[k-1]

  # draw a circle around the green instance with a radius corresponding to the observed distance
  r = k_distance + 0.05
  circle = plt.Circle((green_instance[0], green_instance[1]), r, color='gray', linestyle='--', fill=False)
  ax.add_patch(circle)

  # finally, display the neighborhood
  plt.show()
Agora pode escolher o valor de k movendo o controle deslizante, em seguida, plotar o bairro e decidir a qual classe a instância verde pertence. Para traçar o bairro, precisa executar a célula.
k = 3 # @param {type:"slider", min:1, max:12, step:1}
show_neighborhood(k)
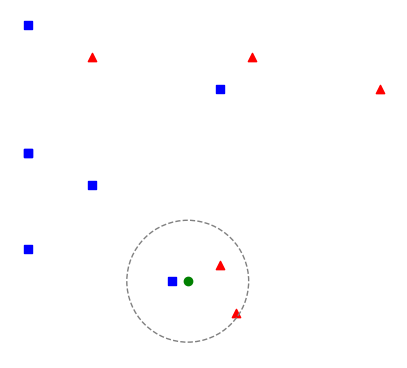
A célula a seguir contém uma função que classifica uma nova instância com base nas instâncias dadas usando o algoritmo k-nearest neighbors. Depois de considerar a qual classe a instância pertence, pode verificar sua conclusão executando essa função.
def euclidean_distance(instance1, instance2):
  return np.sqrt((instance1[0]-instance2[0])**2 + (instance1[1]-instance2[1])**2)
def kNN(k, instances, new_instance, classes={0: 'red', 1: 'blue'}):

  # first, calculate the distances between the new instance and all instances in the dataset
  distances = [euclidean_distance(instance, new_instance) for instance in instances]

  # then sort the distances, extract the k smallest ones and the corresponding instances
  # declare them as neighbors
  neighbors = np.argsort(distances)[0:k]

  # then read the labels of the neighbors and count them
  neighbor_labels = [instances[neighbor][2] for neighbor in neighbors]
  label_counts = np.bincount(neighbor_labels)

  # the label of the new instance will be the label of the most frequent neighbor
  label = np.argmax(label_counts)

  return classes[label]
kNN(3, instances, green_instance)
Out[15]:
'red'
Completion requirements:
- Make a submission